+1 855 796 4355
Power BI new updates: Data bars for new table & matrix preview
In this blog article, I will explain about the new updates of Power BI related to Data bars for new table & matrix (preview). These are the new type conditional formatting to the table and matrix visual called as data bars. Data bars are a quick way to format data and to make it easier to compare.
There are two ways two ways to turn on data bars.
1) From the Field itself and
2) From Menu
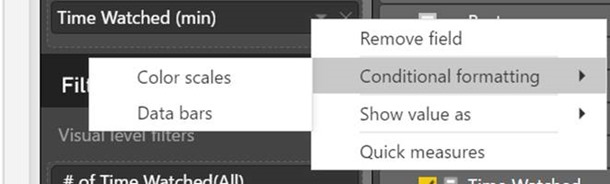
Select Data bars on any numeric measure from your matrix or table.
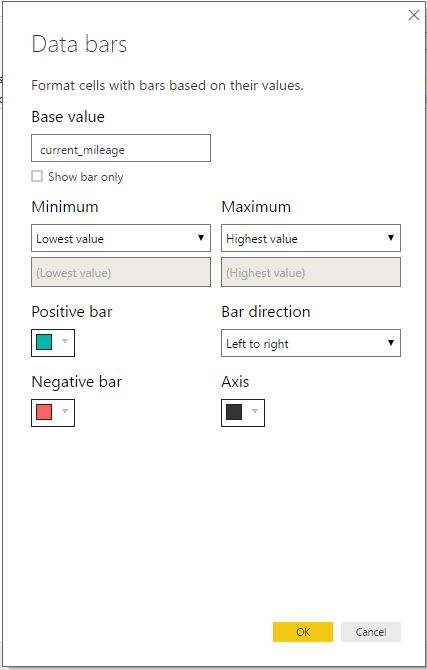
This launches a dialog for customizing the data bars.
We can set the properties for data bars like we can set the bar color , min and max value. See below screen captured:
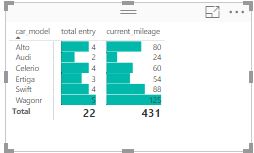
Once you confirm with settings, you’ll see the data bars applied to the visual.
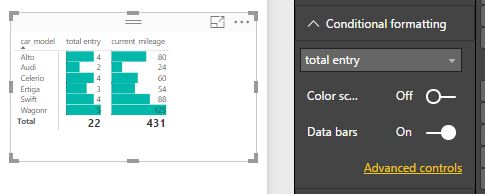
You can also turn on color scales and data bars from the formatting pane by selecting Conditional formatting. Set Color scales or Data bars to On to apply the default settings or, to customize the settings, select Advanced controls.